Sometimes when I feel a bit blue, or lonely, or curious, I go back to my journal entries from a year ago to see how Armita was doing on the same day last year. It kind of reinforces this quote in my mind:
"Nothing is ever as good or as bad as it seems at the moment."
Now one might get bored after a while of seeing only the messages from the date last year, and instead want to search "when did I in the past few years feel the same as now?". And that's where math comes to help us. At the end of this blog, we will come up with a way to plot our thoughts and journals in a 3D semantic space, and if you wish, we can make a clustering of the themes. Sounds cool, huh?
I'd like to mention that for the sake of safety reasons I'm only sharing some of the information about my data, but I've shared the code on GitHub and will continue to contribute to it.
Cleaning and Parsing the Data
First things first, we have to clean our data. The data I have is about six .html files containing a few types of media, but I only wish to work on the texts, as they describe how I feel the most. I had to clean the data from service messages, photos, videos, audio messages, and a few other types of media that were unwanted.
At the end, I came up with a clean .csv file that has the structure I want: message number, timestamp, datetime, type, and text. Now that we have parsed our data, we let the exploration begin.
Exploration
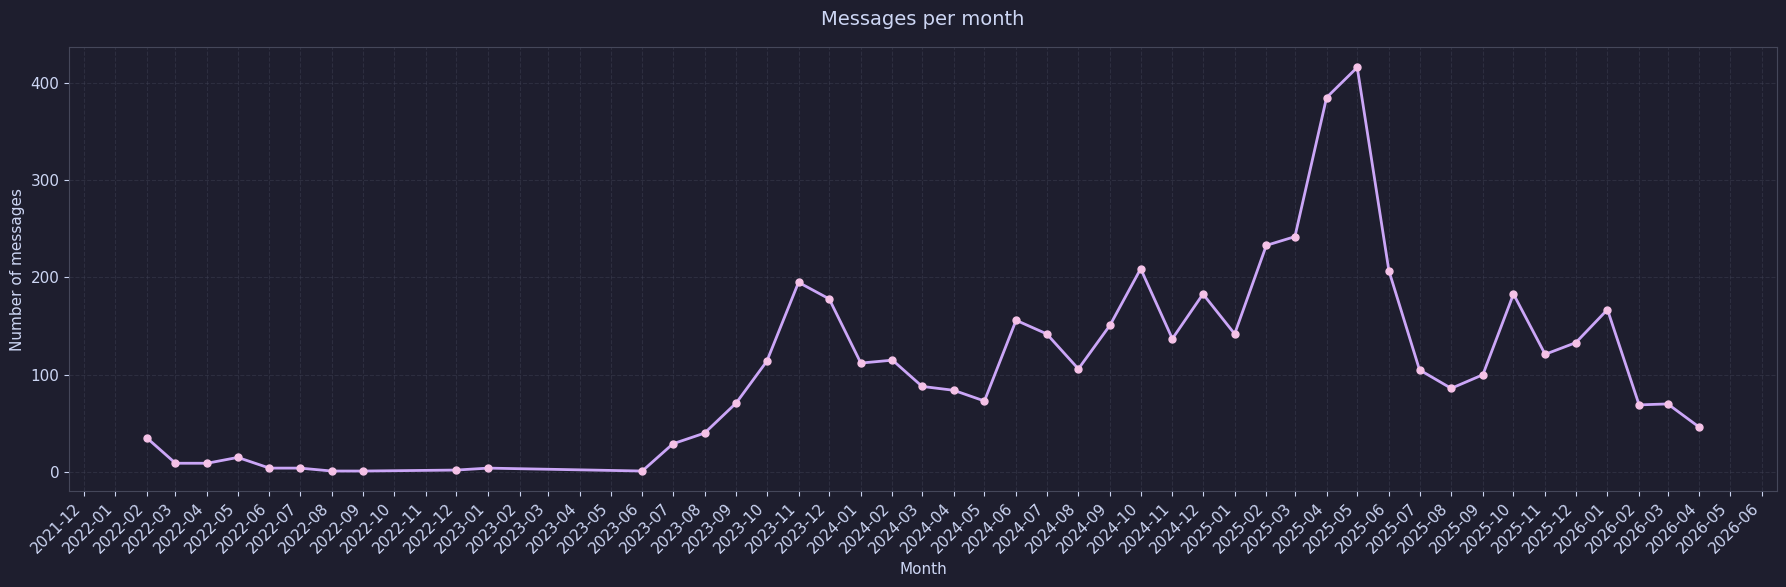
The data I have collected is a set of 4,973 messages in the timeline of four years.
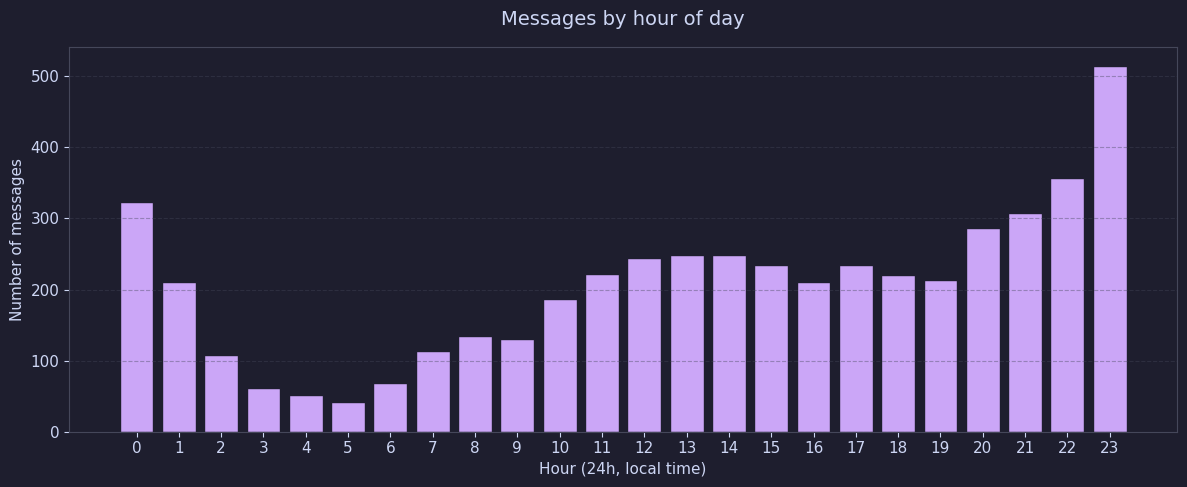
The image below shows the distribution of messages by hour of day. As expected, I usually write before going to bed, or I tend to write when I'm awake and no one else is. There's an upward shift midday too, which is interesting.
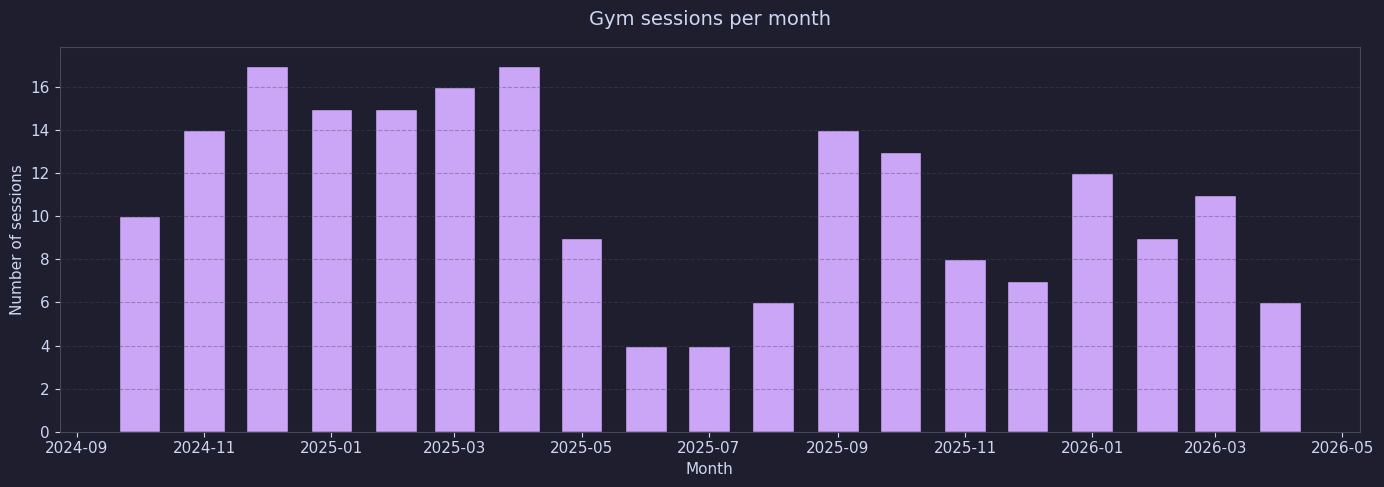
Another thing I track in my journals is my gym sessions. Ever since I started university for my bachelor's degree, I picked up the habit of going to the gym, and I'm happy I've been pretty consistent with it. This consistency will give us a really interesting observation later in the embeddings part. Let's see a few exploration trivia for now:
Gym sessions were tracked by a code I made up, which is G-session number, like G-1, G-2, etc.
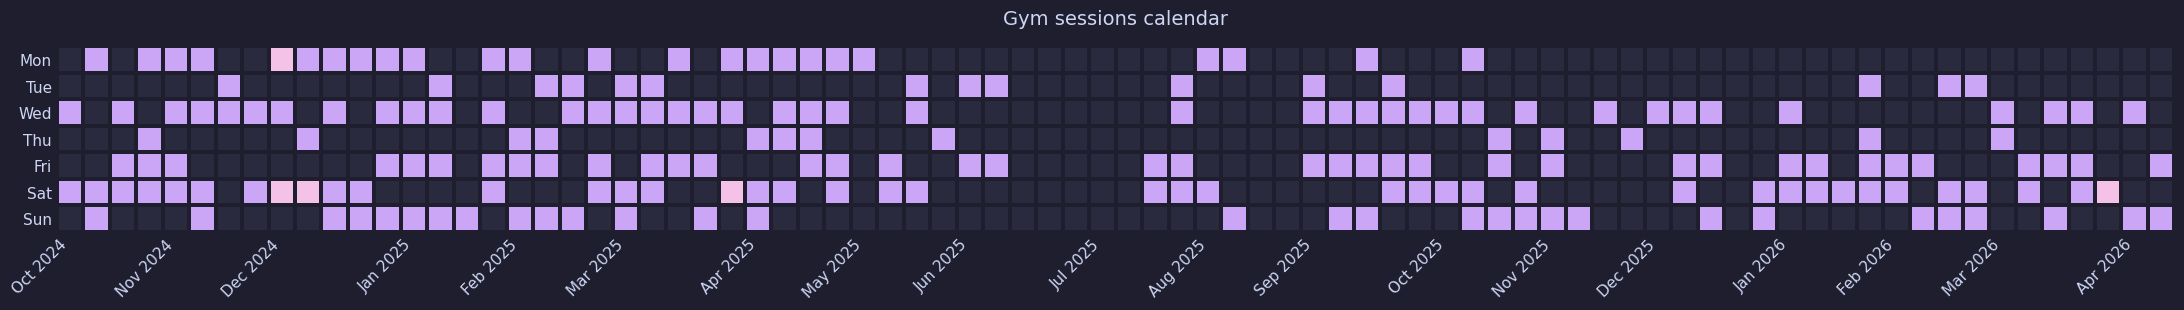
I realized I wanted to make it into a contribution graph, like the one on GitHub. This is what I came up with:
I've also made the word cloud of all the texts, a beautiful visualization of most common English words, but I will not share it in this blog. You can find the block of code on GitHub with the Markdown "🌟 WORDCLOUD". The word cloud is with the stop words removed so that your final image is not filled with articles.
One obstacle I ran into was my texts being bilingual. But this was even more interesting to me, because perhaps the data could tell me what language I think in:
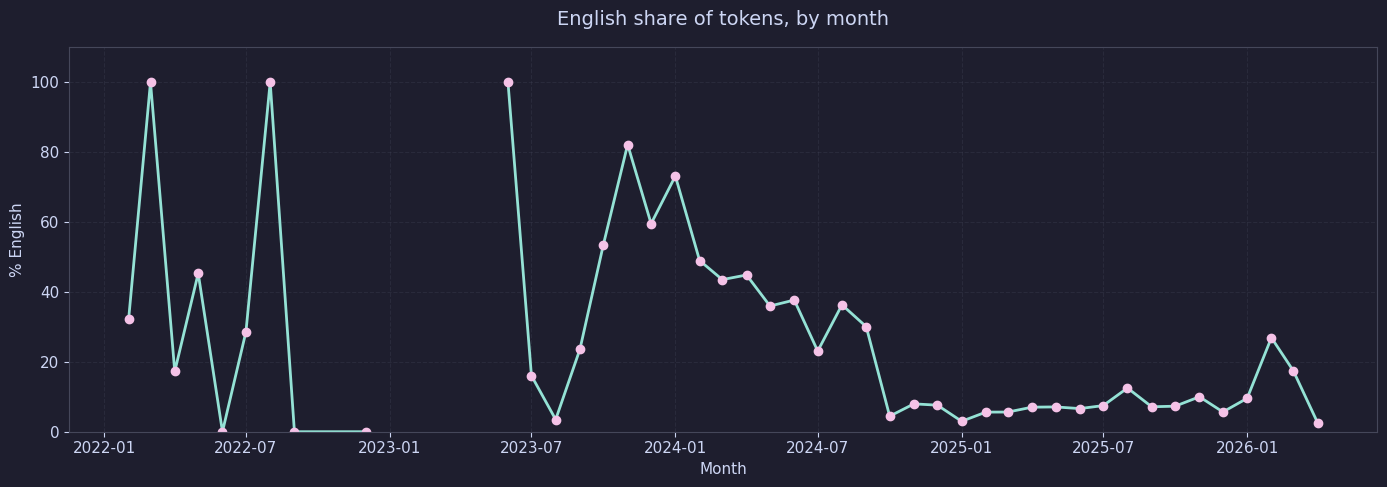
Interestingly enough, there is a boom and bust activity with the English share of tokens, basically a word, but a little bit different, per month. The first two 100 percent shares are probably because there were very few messages back then, and they were all in English. But the share of tokens later on is more meaningful, with most months again being 100 percent. I've been asked a few times what language I think in, and I have to answer both, I guess the data says so too. :)
We've explored the data enough. This was a very rewarding part of this project. With simple blocks of code you could find out so much about the data. Our next step is my favorite, which is embedding.
Embedding
This phase is the project's core question: finding messages similar to a target message. Let's pause here before we touch code.
An embedding is a way of turning a piece of text into a list of numbers, which we'll later gather into a vector. These are not random numbers: the model that produces them was trained so that texts with similar meaning end up with similar vectors, even if they share no words. A message in two or more different languages with the same sentiment will also be nearby, because we're using a multilingual model.
The geometry of this space becomes the meaning, and finding messages similar to any given one becomes a question of finding nearby vectors, which is just math.
The model I'm using in this project is the paraphrase-multilingual-MiniLM-L12-v2 from sentence-transformers. It supports 50+ languages including Persian and English, which were the languages I used in my texts. The model returns 384-dimensional vectors, and was small enough to run on CPU.
After setting up the environment and running the model on the text messages, we create two functions: find_similar_to_message and search. The first finds messages similar to an existing message; the second lets you search by typing any text.
Let's test it out. I'll do a search on the word biking:
query = "biking"
results = search(query, top_n=5)
display_results(
    query_text=query,
    results_df=results,
    title="Top 5 results",
)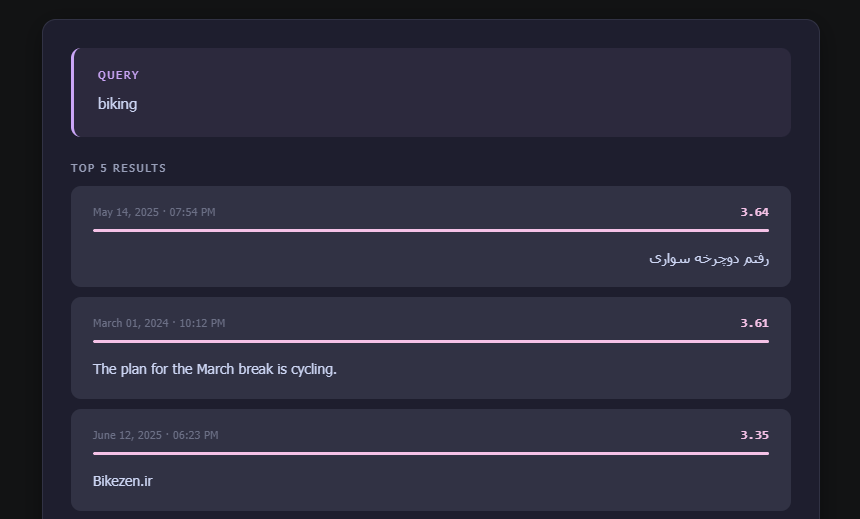
The first message is "I went biking" in Farsi, and the third one is a really old Persian website about biking by Jadi that I found on Twitter. The word "Bikezen" makes me think about how words are turned into tokens in semantic search.
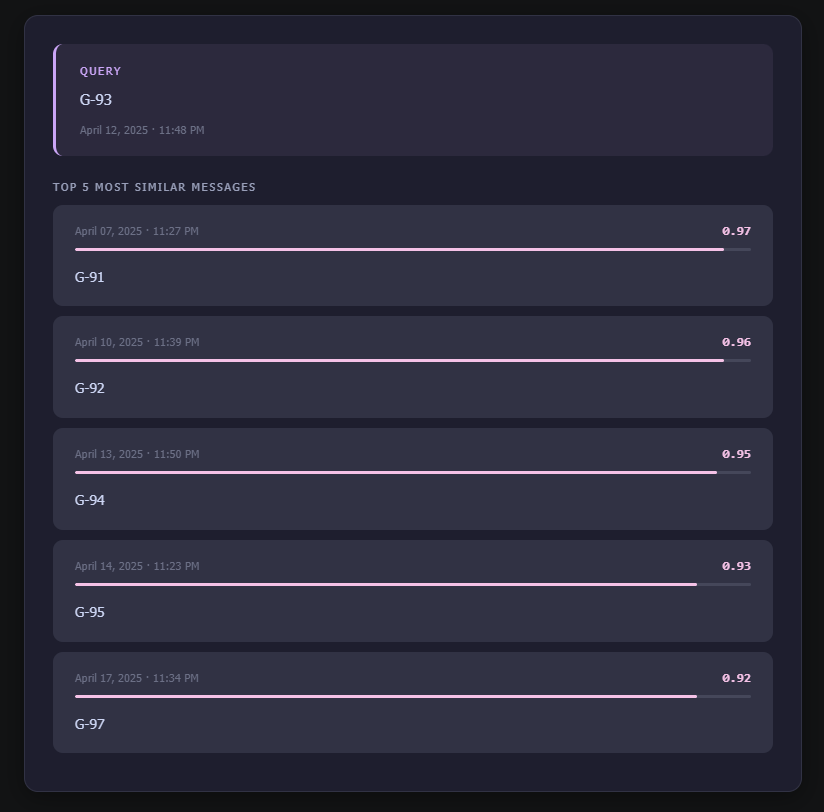
Trying find_similar_to_message on a random entry, I came across the gym sessions, and noticed how numbers close to each other are grouped as having similar meaning. Just an interesting observation:
Now that we've done the embedding, I'd like to project the vectors down to 3D and scatter them. I'm using UMAP, which reduces my 384-D embeddings to 3D while preserving meaningful structure. I've made it interactive with Plotly so I can rotate, zoom, and hover. You can find the code for this in the last cell of the embeddings.ipynb file.
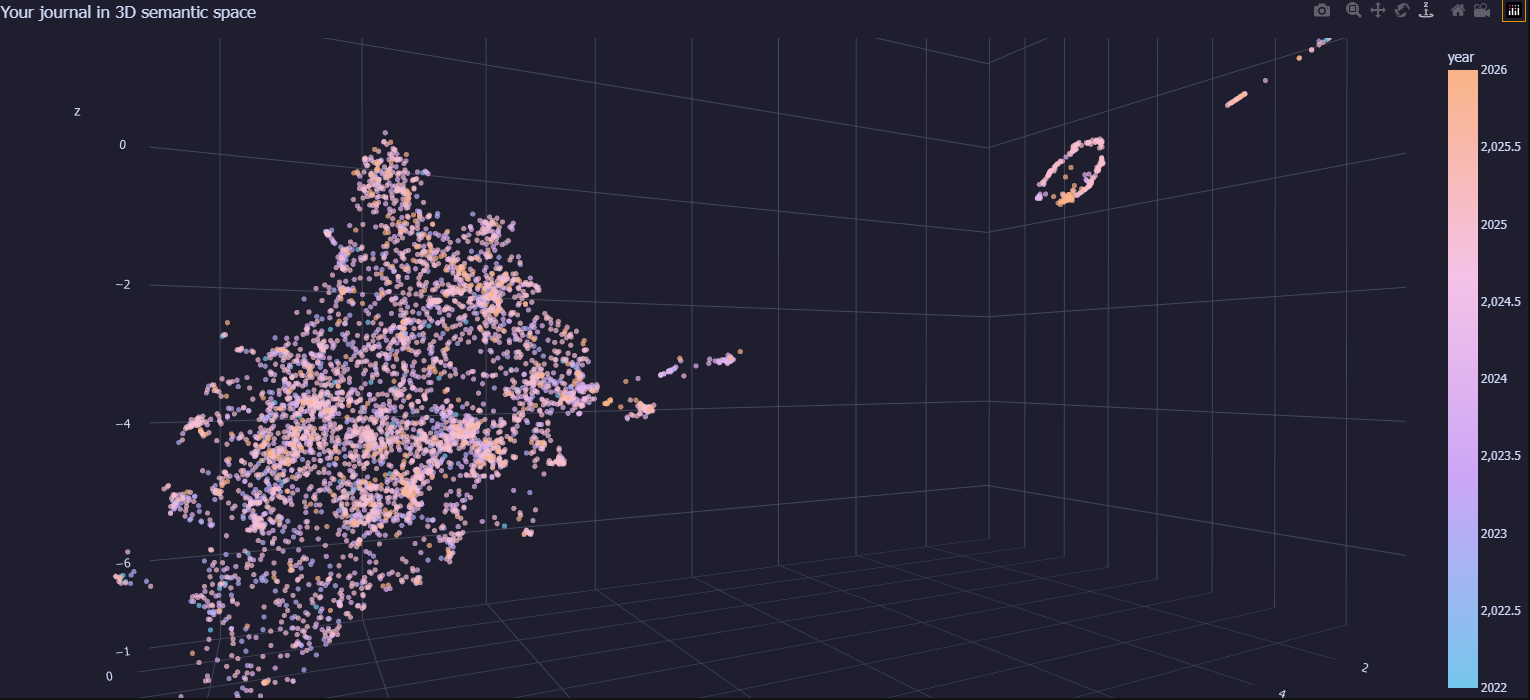
Here comes the pretty map of a mind. For now, the colors show the date each message was posted. Each message shows up as a label when you hover over its dot. Pretty amazing how the points that end up next to each other really are similar in meaning. You might be wondering: what is that circular cluster in the top right corner of the map? Let's zoom and see.
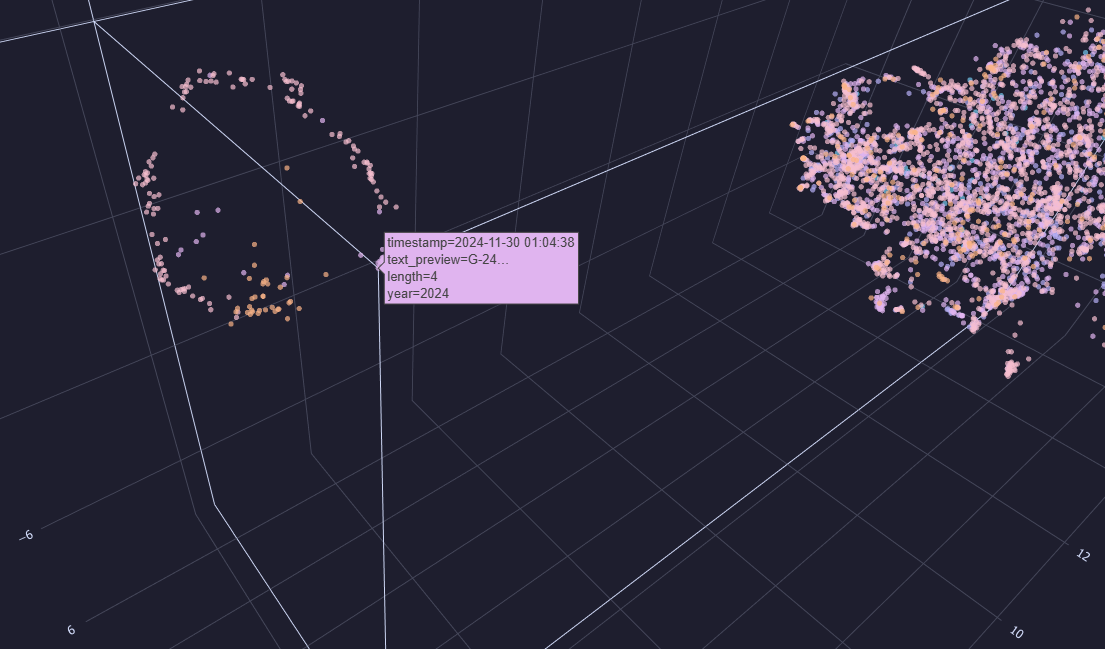
Each of these dots is one gym session. Isn't that fascinating? The messages just outside the circle are there because they include a little note about the gym session on the line after. I'd really like to know if it would make a perfect circle if those notes weren't there.
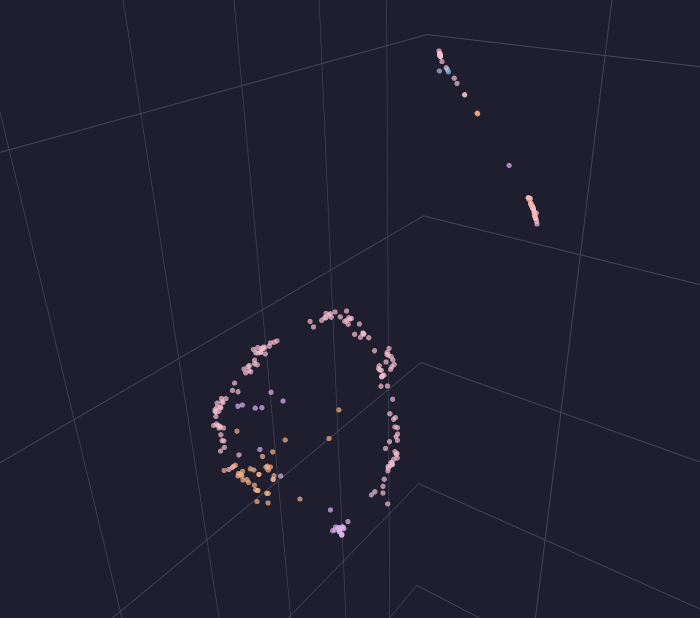
The dots forming a line in the upper right corner are three other habits I started, but they aren't as frequent as the gym sessions, so that's why they show up like that. I'd like to see what shape they'd form if I keep them up.
We're done with the embeddings. Let's go to our next stop, clustering.
Clustering
In this phase, we want to turn the visual blobs into named topics. We do this in two steps:
- Clustering: assign each message a cluster ID, see how many natural groups exist.
- Naming + recoloring: pull representative words from each cluster, then repaint the 3D plot by cluster.
For step 1, I'm using K-means clustering with k=15. K-means is a classic algorithm: you tell it how many groups you want, and it works out the best way to split your data into that many groups by minimizing the distance between each message and its cluster's center. Every message ends up with a label from 0 to 14, no noise category, every message belongs somewhere. Why 15? I tried a few values and 15 felt right.
For the next step, I used c-TF-IDF (class-based TF-IDF). Regular TF-IDF would hand me the most common words in each cluster, but those tend to be everyday vocabulary that shows up everywhere. c-TF-IDF asks a more useful question: what words are distinctive to this cluster compared to all the others? That's what gives the clusters their personality.
When I repaint the 3D plot by cluster instead of by date, the structure of my journal becomes legible in a new way. I can see the regions of my own writing.
Looking Back
What this project really gave me isn't a fancy NLP pipeline; it's a way to read myself from a distance. I can now ask the journal a question and have it pull back everything I've ever written that sounds like the same feeling, even if it's in a different language.
There's a lot more I want to do with this. I'd like to see the line-shaped clusters from the newer habits become rings. I want to build a small interface so I'm not opening a notebook every time I want to search. And maybe most of all, I want to come back to this in a year and see how the shape of the map has changed.
But for now, this is what I have: four years of thoughts turned into geometry. The quote I started with feels even more true after building this. And most importantly, when you can see four years of yourself as a single object, it's easier to be kinder to the version of you writing today.